

Over the past year, I’ve spent a lot of time in the trickiest parts of Model Context Protocol: authorization flows, security, and the messy reality of how clients behave in the wild.
MCP is exciting, and for good reason: it gives AI systems a common way to connect to the rest of the software world. But the ecosystem is still young, and there is often a gap between what looks correct on paper and what actually works with real clients.
I’ve seen teams run into that gap repeatedly. Local testing may look fine. Smoke tests may pass. But when a real agent connects — especially over HTTP and with authorization involved — problems appear that are non-trivial to solve.
I got tired of debugging these issues by hand, so I built MCP Debugger.
Why authorization and security are the hardest parts
My background is in authentication and web security (I’m known for explaining OAuth and OpenID Connect in plain English). My role as a founding engineer building MCP infrastructure at Arcade.dev has given me a front-row seat to the practical challenges of building secure, production-grade MCP systems.
Risks like the lethal trifecta mean that getting MCP security right matters a lot, but that doesn’t mean it is easy. Even with a deep background in OAuth and API security, getting this right in practice can be very hard.
Once you move beyond local toy examples and start building production-ready MCP servers, you quickly run into the fact that secure interoperability depends on a whole chain of standards and expectations working together correctly. It’s not just “add OAuth” and move on.
You’re dealing with OAuth 2.1, PKCE, protected resource metadata, CIMD, and several pieces of machine-readable metadata that all have to line up. If any one of those pieces is missing, malformed, or served in a way the client does not expect, the whole flow can fail. (And that’s assuming the client is working correctly.)
That’s why this problem space interested me so much: I could see early that security and authorization in MCP was a place where teams would need better tooling.
Why I built MCP Debugger
I built MCP Debugger for myself first. I needed a faster, more systematic way to answer a simple question:
If a real MCP client tried to use this server, what would actually happen?
Not “does the server look plausible?”
Not “does the happy path work on my machine?”
What actually happens when a client connects, negotiates, authorizes, discovers tools, and tries to reason about what the server exposes?
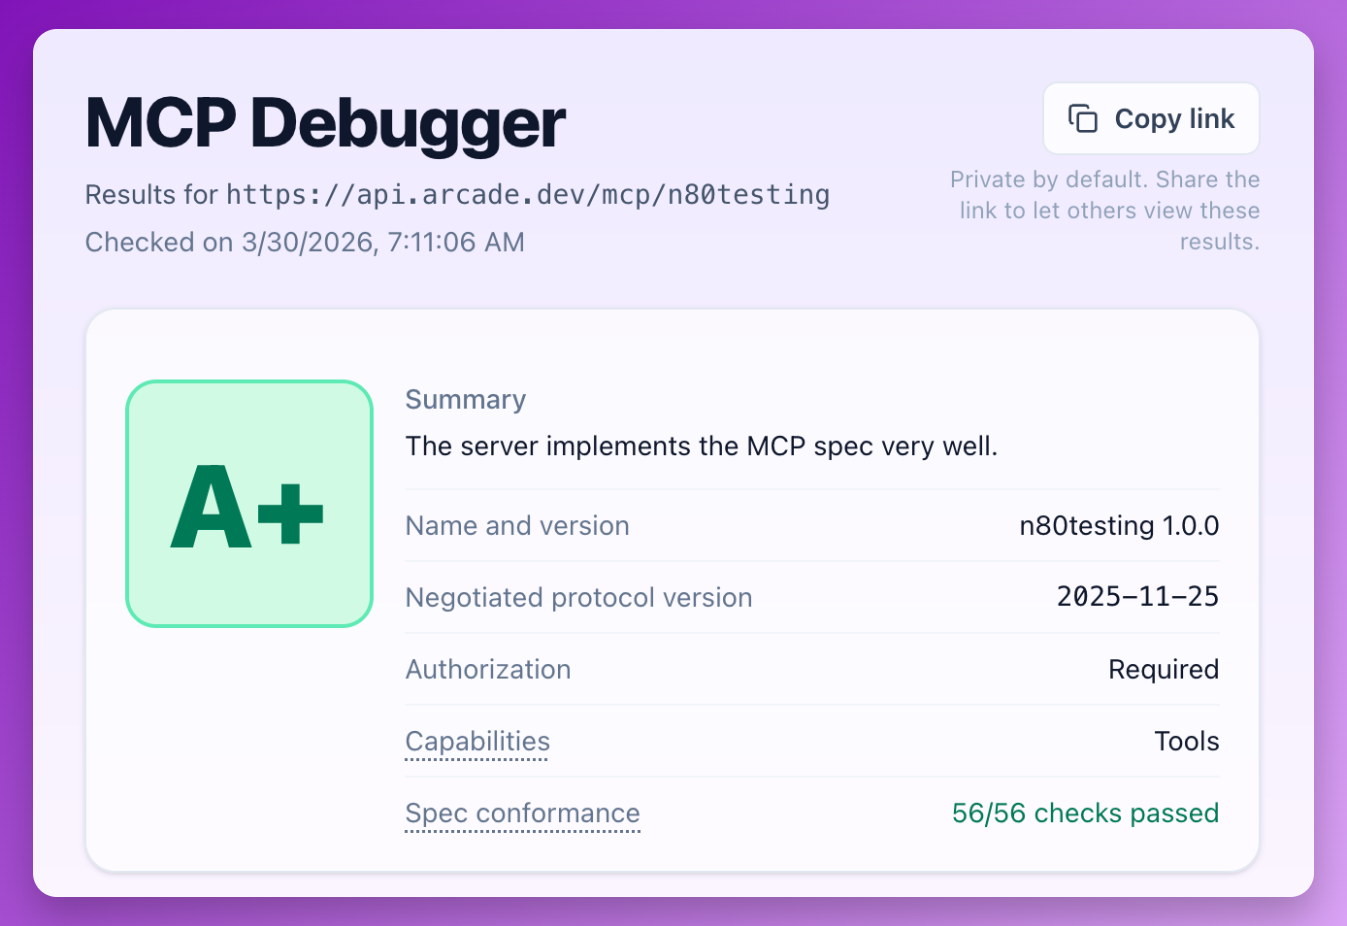
Given a server URL, MCP Debugger interacts with the server the way a real client would. It attempts connection and authorization flows, discovers tools, inspects metadata, runs protocol-level validation checks, and produces a report showing where the implementation deviates from what agents and clients are likely to expect.
The goal is not just to say “pass” or “fail.” The goal is to make the obvious — and not-so-obvious — failure modes visible.
What kinds of problems it helps catch
The issues I most often see fall into a few buckets.
1. Authorization flows that don’t work end-to-end
This is by far the biggest category of problems in real-world implementations.
A server might expose the right endpoints, but still fail because metadata is incomplete, URLs are inconsistent, PKCE handling is off, or a required part of the flow is implemented in a way that does not match what clients expect.
These are not always obvious bugs. Often they are almost-correct implementations, which can be extra-frustrating because they are hard to trace.
2. Tool metadata that leaves too much room for guessing
Agents depend heavily on tool metadata to decide what a tool does and how to call it.
If descriptions are vague, schemas are incomplete, or parameters are underspecified, the model has to guess. And when a model guesses, it can guess wrong.
That means a server can be reachable and technically functional while still being hard for agents to use reliably.
3. The spec as a moving target
MCP has been evolving quickly, especially around authorization and security. That evolution is healthy because it reflects an ecosystem that is actively learning and improving. But it also means developers are building against a moving target, and the tradeoffs are not always well documented yet.
Server frameworks and SDKs can have hidden gaps, especially soon after a new spec version is released. Many clients also have gaps, which makes it hard for teams to know whether a failure is due to their own bug, an outdated assumption, a client problem, or something else.
MCP Debugger helps narrow that uncertainty.
Contributing back to the ecosystem
MCP Debugger builds on modelcontextprotocol/conformance, the open-source test suite for MCP protocol correctness. This gives the ecosystem a critical shared baseline for what “correct” means. When MCP Debugger scans a server, it runs many checks directly from the conformance suite.
What excites me most is the feedback loop this creates: MCP Debugger sees the messy real-world failures that happen when clients and servers actually meet, and those lessons can flow back upstream into the conformance suite as new checks and improvements. I’ve already been able to contribute a few checks to improve spec coverage, with more on the way.
Try it out
If you’re building an MCP server and want to see how it behaves from a client’s point of view, give MCP Debugger a try!
It’s still early, and there’s plenty of room for improvement and new checks as the ecosystem continues to evolve. If the tool helps you find a bug, or if you have ideas on how to make it more useful, I’d love to hear from you.