
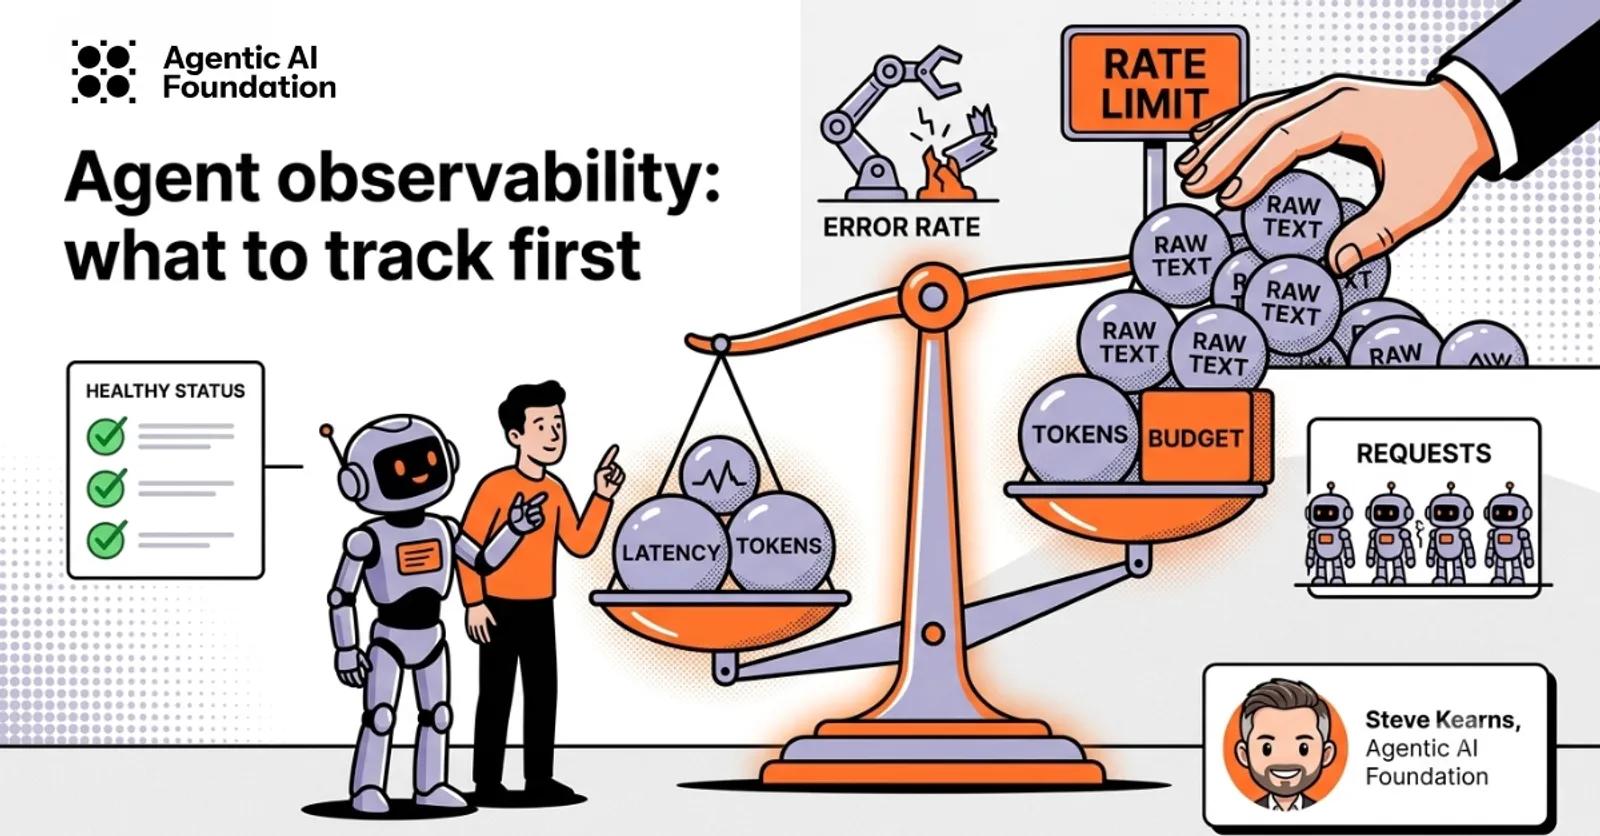


Standard monitoring misses this kind of failure. The run keeps dying partway through, and from outside it looks like a flaky tool or a bad model day. At Port of Context, the cause only showed up once someone counted tokens. Their go-to-market agent was pulling so much raw text into context that it hit a rate limit late in the run, after most of the budget was already gone. Nobody saw it until they measured it.
The usual production stack still applies to agents. Request rates, error rates, latency percentiles, structured logs, distributed traces - keep all of it. What it does not tell you is whether the agent did sensible work. A run can return a clean status code, throw no exceptions, and still have called the wrong tool, worked from stale data, or looped for ten minutes before giving up. The service stayed healthy while the work went wrong.
That is the gap. What follows builds on a recent community session with Port of Context and on current practice across the open runtimes, with the goal of being concrete enough for a team to decide what to track first.
Why observing an agent is different
A traditional service handles a request and returns a response, and you can reason about it through input, output, latency, and status. An agent run is a sequence of decisions. It reads a prompt, picks a tool, reads the result, decides what to do next, and repeats, sometimes for dozens of steps, sometimes handing parts of the work to other agents. The useful unit of observation becomes the whole run rather than any single call inside it.
Three things make that run harder to observe than a normal request.
It is non-deterministic. The same input can produce a different sequence of tool calls on two runs, so a single log line tells you little. You need the shape of the run to judge whether it went a reasonable way.
Failures are easy to miss. A model can return a confident, well-formed answer that happens to be wrong, choose a plausible tool that was the wrong choice, or stop early and report success. Nothing throws, and standard error monitoring stays green while the output is useless.
The expensive part is hidden by default. Cost and failures pile up inside the run - in the context that got loaded, in the tokens each step burned, in the tool that returned a wall of text and tipped the run over a limit. Watch only the edges and you miss all of it.
So the job has less to do with uptime and more to do with reconstructing a run after the fact - what it did, in what order, why, and what it cost.
The signals, and what each is for
Five signals answer different questions, and teams get into trouble when they expect one to cover everything.
- Logs give you local detail for debugging. The raw events, in order, with IDs and errors. Cheap to produce, hard to read at volume.
- Traces show how the events relate, organized as a tree with the run at the top and model calls, tool calls, retrieval steps, and sub-agents nested underneath. This is usually the missing layer for agents.
- Metrics show trends worth alerting on, such as success rate, tool error rate, loop count, cost, latency, and token use.
- Evals check whether the behavior was any good. Tracing tells you what happened; evaluation tells you whether the result was correct, relevant, and efficient.
- Human review handles the cases automated checks were not written for yet, and is usually where the next round of evals comes from.
Most of the work that follows is about getting traces, cost, and failures into a shape where evals and review are quick.
Tool-call traces
A tool call is where model output becomes action: a search, a Slack message, a file edit, a shell command, a database write, a payment. That is also where the most interesting failures live, and where a normal monitoring stack has the least to say. The backbone of agent observability is a trace that captures every model call and every tool call as a nested span tree, with the run as the root.
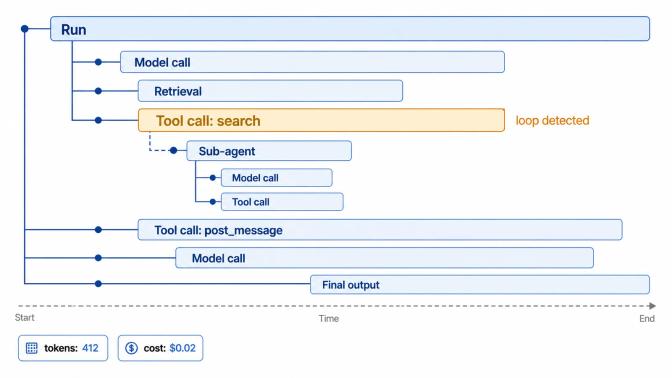
A single agent run as a nested span tree. Time runs left to right. Model calls and tool calls sit beneath the run span, with a sub-agent recorded as its own linked trajectory.
Tracing like this is increasingly available across the open runtimes, though by different routes and at different levels of maturity, so treat the following as illustrations rather than a survey. OpenHands ships built-in OpenTelemetry tracing in its SDK, producing a tree of conversation, run, and agent step, with a model-call span and a tool-execution span under each step. Goose can export OpenTelemetry traces that you view in a backend such as MLflow or Langfuse, capturing its model calls, tool executions, and token counts. OpenClaw provides an official diagnostics-otel plugin that exports OpenTelemetry metrics, traces, and logs over OTLP/HTTP, including spans for model calls, tool execution, context assembly, and tool loops. Hermes is more transcript-first today, with an optional Langfuse observability plugin and open feature requests such as issue #6741 proposing structured session traces with stable IDs and parent-child timing. The common thread is that a run can be reconstructed as a tree. The differences are in whether that comes built in or through an integration, and how far each project has taken it.
Underneath most of this sits OpenTelemetry. Its GenAI semantic conventions define standard names for these spans and their attributes, with an invoke_agent span at the top, chat spans for model calls, and execute_tool spans for tool calls, carrying token counts and finish reasons. They are still marked experimental as of mid-2026, so attribute names can move, but the major backends already read them.
A redacted tool-call span might look like this. Treat this as pseudo-JSON rather than a fixed OpenTelemetry schema, since the GenAI conventions are still evolving.
{
  "name": "execute_tool github_search_issues",
  "trace_id": "0af7651916cd43dd8448eb211c80319c",
  "span_id": "b7ad6b7169203331",
  "parent_span_id": "e9d5cb2b3adfda40",
  "duration_ms": 1247,
  "status": "ok",
  "attributes": {
    "tool.name": "github_search_issues",
    "tool.call_id": "call_9f2a8c",
    "tool.arguments": "[REDACTED_AT_CLIENT]",
    "tool.result_summary": "10 issues returned, 3 open",
    "usage.input_tokens": 412,
    "usage.output_tokens": 88,
    "cost.estimated_usd": 0.0021,
    "redaction.status": "applied_before_export"
  }
}
The current change worth building around concerns MCP. The 2026-07-28 MCP specification documents W3C Trace Context propagation inside MCP request metadata and fixes the key names traceparent, tracestate, and baggage. Several SDKs were already doing this informally. Pinning the names means a trace that starts in your host application can follow a tool call through the client SDK, the MCP server, and whatever that server calls downstream, then arrive in an OpenTelemetry backend as one span tree. The same specification deprecates MCP's own Logging capability and points structured observability at OpenTelemetry instead, with stderr as the fallback for local stdio transports. It is an annotation-only deprecation, so existing Logging keeps working for at least a year, and new work can assume OpenTelemetry is the path.
One caution comes with trace context. The baggage field can carry your own metadata across a workflow, but it propagates further than people expect, so keep it small and low-sensitivity (a tenant tier, an environment, an experiment ID) and keep prompts, user text, secrets, and retrieved content out of it.
A related caution about redaction. Tool arguments, tool results, retrieved content, and prompts can all end up in spans, and any of them can contain PII, credentials, or corporate secrets. Redact sensitive data as early as practical, ideally at the client SDK or runtime boundary before it leaves your trusted environment. If an OpenTelemetry Collector runs inside that trusted boundary, it can also filter, transform, or redact telemetry before export to the backend.
Context and retrieval
For a lot of agents the failure is in the context rather than the model call. The agent searched the wrong source, worked from stale documentation, used a cached tool list that no longer matched the server, or had so many similarly named tools in scope that it picked the wrong one.
Two things crowd the context window, and both are worth watching. Anthropic's engineering write-up on code execution with MCP sets them out. Tool definitions loaded upfront take space before any work happens, and intermediate tool results get passed back through the model on every step. For one specific example workflow, Anthropic reported a drop from roughly 150,000 tokens to about 2,000 by having the agent discover and load only the tools it needed and process data in code, outside the model's context. Treat that as Anthropic's scenario rather than a reduction you should expect, since savings depend entirely on the workload. The underlying pressure is general, though, and Cloudflare and others have described the same pattern under the name "code mode."
The Port of Context session is a community example of the same idea. Their go-to-market agent reached several tools through a gateway, and loaded the usual way, every tool schema would sit in context on every call. Their approach used progressive disclosure, where the agent looks up only the tool definitions it needs, then batched several calls in a short script and filtered the results before any of it returned to the model. In their case study the code-execution version stayed well inside the token budget and completed, while the version without it hit a rate limit partway through. For observability the useful part is the measurement. They could only spot the failure because they were tracking tokens and context use per run; before that it looked like a model problem.
You do not need to store every token that crossed into the model. A compact "context receipt" per run is enough. A useful one records:
- prompt version and tool-catalog version
- the tool schemas available to the model for that run
- retrieval source IDs, and the query text or a query hash
- any rewritten query
- retrieved document IDs, with versions or timestamps
- scores and ranks, and which documents made it into the prompt
- the token count retrieval added
- cache status and redaction status
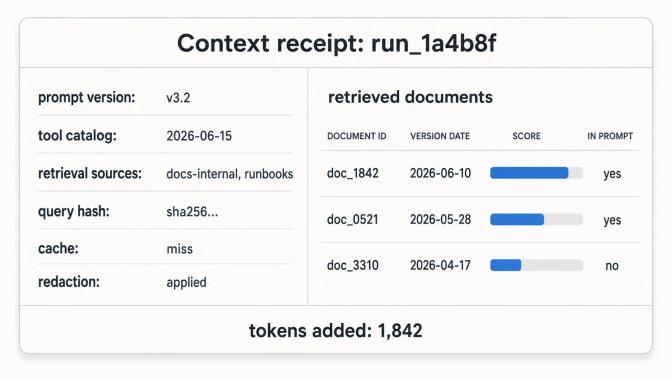
A context receipt for one run, showing what metadata to capture without storing the raw context itself.
With that, you can tell whether a bad answer came from the model, the retrieval layer, the tool catalog, or context bloat. If you cannot see what context crossed into the run, you cannot reliably explain the decision the agent made.
Cost and token spend
Agent cost is more than model cost. A single run spends tokens on system instructions, tool schemas, retrieved documents, intermediate reasoning, retries, tool outputs, sub-agent calls, and the final answer, and it can spend money downstream in search APIs, browser sessions, hosted sandboxes, and paid data sources. The cost lives in the steps.
Three things are worth tracking from the start. Tokens and cost per run, broken down by step, so an expensive run tells you which step was expensive. Where sub-agents spend, because a multi-agent run can look cheap at the top while the real spend sits in its children. And rate limits and their cause, since a per-minute token ceiling is a failure mode in its own right and, as the Port of Context run showed, often traces back to context volume.
A note on latency. Raw wall-clock latency still matters for user experience, timeouts, and regressions, but it is incomplete on its own for agents. A five-minute multi-step run and a two-second answer should not sit in the same alert bucket. Track normalized latency alongside the raw number: latency per step or tool call, latency per 1,000 generated tokens, and step-to-token ratio. That last one can be a useful early signal for loops or inefficient runs.
Two cautions on numbers. Token counts from a runtime's own logs are usually reliable, but cost figures depend on a pricing table you have to keep current, so treat dashboard dollar amounts as estimates. And vendor or vendor-adjacent savings figures are best read as workload-specific rather than as a number you can plan around. Measure your own workload before you rely on someone else's.
A failed run that costs a fraction of a cent is a nuisance. A looping run that costs several dollars and produces nothing is an incident, and you only catch it if you track cost by run and by failure type rather than as an average.
Single call, full run, multi-agent
The questions change with scope.
For a single tool call, they are direct - did the model pick the right tool, were the arguments valid, did the tool run, what came back, and did the model read the result correctly. This is closest to ordinary API monitoring, and the MCP trace-context work above is mostly aimed here.
For a full run, the sequence matters - did the agent gather enough context before acting, did it retry with new information or repeat itself, did it verify the result, and did it stop cleanly or leave partial work behind. This is where the span tree matters most, because loops and dead ends show up as a shape long before you read any content.
For a multi-agent workflow, you also need handoff visibility - which agent owned the task, what it passed on (a summary, shared memory, an artifact, a fresh prompt), whether the child inherited permissions, and whether the parent validated the child's result. The useful pattern is to treat each sub-agent as its own linked trace, recording a parent-to-child link when it spawns so the child gets its own trajectory rather than being flattened into the parent. Several projects handle sub-agents this way.
Two observations from the same session are worth carrying in. A builder agent and the agent that checks its work should be separate, with separate context, because an agent that both builds and validates tends to trust its own work and skip checks, which makes the validation signal you are recording unreliable. And an orchestrator's own thread can stay small even when the full run is large, because the heavy context sits in the sub-agents. That makes the orchestrator trace a readable index into a run that would be unmanageable if every child's tokens were inlined.
Failure types
"The agent failed" is too vague to act on. A small, consistent failure taxonomy makes runs faster to triage. Here is a working set.
- Wrong tool. The agent picked a tool that could not do the job, often because two tool descriptions overlapped.
- Right tool, wrong input. The correct tool called with a bad argument, such as a wrong ID, a malformed query, or a guessed parameter. The response can look clean and still be useless.
- Missing permission. The agent lacked a token, scope, or approval, or held more access than it should have.
- Stale context. The agent worked from old docs, an expired cache, or session memory that no longer applied.
- Bad retrieval. The agent searched the wrong source, used a weak query, pulled low-quality documents, or ignored better-ranked evidence.
- Tool-result misread. The tool returned what was needed and the model interpreted it wrongly.
- Loop. The agent repeats an action or cycles between a few without new information, burning tokens and time.
- Partial or unverified completion. The run reports success having done only part of the job, or having skipped the check it was supposed to run.
- Handoff failure. A sub-agent got incomplete instructions or lost a constraint, and the parent did not catch it.
These share a property that defeats standard monitoring. No exception is thrown, the run completes, the dashboard stays green, and the only way to catch the problem is the trajectory or an eval that checks the result. MCP-level faults are starting to be mapped empirically too. A recent paper analyzed 837 fault threads across 473 MCP server repositories and built a taxonomy with 11 top-level categories and 27 subcategories, including protocol, tool, schema, state, model-provider integration, security, and timeout or cancellation faults. It is a useful reference, though new enough to treat as a pointer rather than settled ground.
Evals and human review
Once you can see what a run did, the next question is whether it was any good, and that is a different measurement. Useful eval suites test two things. Outcome checks ask whether the final result is correct, things like whether the code passed tests, the answer matched the facts, or the workflow completed. Process checks ask whether the route was acceptable, whether the agent used approved tools, verified the result, stayed within budget, and avoided private data.
Process matters because a correct result can hide a bad run. A 2026 study of SWE-agent trajectories, AgentLens, found that outcome-only scoring treats a clean solution and a chaotic trial-and-error one the same when both pass, and classified 10.7% of the passing runs in its sample as a "lucky pass" because of regression cycles, blind retries, or missing verification. The finding should not be stretched beyond that study, but it makes a point that holds more widely. A passing test does not guarantee a sound run.
A model-graded check, often called LLM-as-judge, is how teams score things with no exact answer, and it can read a whole trajectory rather than a single output, flagging loops, wasted steps, or a path that wandered. Use it where deterministic checks do not fit, and keep in mind that it costs money and adds latency, so it is not something to run on every step early on.
Human review should focus on the runs that matter rather than a random sample, and never on every token. Queue a run for review when it had external side effects, high cost, repeated retries, low-confidence retrieval, a missing verification step, a permission change, or a user-visible message. Give the reviewer a compact record (task, plan, tool path, key context, artifacts changed, errors, verification, final output) with the raw transcript as backup. One example from the session: on a hard PDF-parsing benchmark the simplest setup came out ahead, a plain coding agent told to check its own work, beating both a dedicated parser and a custom skill. It is a reminder to measure added tooling against a simple baseline before assuming it helps.
Reviewing a run without reading every token
A single run can be hundreds of thousands of tokens, so reading all of it is not a strategy. Good traces mean you rarely have to. Work top down. Start at the run summary (did it succeed, how long, what did it cost). Filter to the runs that failed or were slow or expensive, rather than reading at random. Open the span tree for one of those and read its shape before any content. Then open only the one or two spans that look wrong. In a multi-agent run the orchestrator trace is your index, so drop into a child only when it points you there.
Generate that run summary from the trace and event log rather than from the model's own account. The agent can tell you what it thinks it did; the trace shows what it did.
Replay is the other thing worth having. Several runtimes store the full event stream of a run so you can step through it or re-run it afterward. OpenHands, for example, records each action and observation so a stored session can be replayed for debugging. The value is the same in each case. You can study what happened without having been there, and compare two runs side by side instead of reconstructing each from memory.
What to track from day one
You do not need a full platform to start, and building one before you have a working agent is a good way to track the wrong things. A small schema that survives tool changes is enough:
- Run identity: run ID, parent run ID, session, user or workspace, environment, runtime, agent and prompt version.
- Model calls: provider, model, latency, input and output tokens, cached tokens where available, error status.
- Tool calls: tool and schema version, arguments with sensitive fields redacted, result status, duration, retries, a side-effect flag, approval status.
- Context: the context receipt described above, at minimum prompt and tool-catalog versions, retrieved document IDs and source versions, context token count, and cache status.
- Cost: estimated model, retrieval, and tool cost, rolled up per run and split out for failed steps.
- Status and failure label: completed, failed, canceled, timed out, partial, or blocked, plus one label from the taxonomy above.
That is enough to debug most early failures and to compare runs across runtimes. You can refine the taxonomy later.
What is too much too early
The opposite mistake is real too. Capturing every prompt and completion in production by default creates privacy, retention, and security problems, so store metadata first and turn on raw-content capture only for sampled runs, failures, or an explicit debug mode. Building a custom observability platform before instrumenting the agent puts effort in the wrong place; consistent OpenTelemetry events come first, a polished UI later. Adding an LLM judge to every step adds cost, latency, and false confidence before you have a baseline to judge against. And a large failure taxonomy nobody applies is worse than a small one used consistently. Start with the trace and the token count, find out how your agent fails, then instrument for that.
From observation to control
Observing a run is a starting point. Once you can see cost climbing, a step count spiraling, or a loop forming, the useful next question is what the runtime should do about it automatically.
Three patterns are worth having. A circuit breaker that terminates or pauses a run when it crosses a cost, step, or duration ceiling, so a runaway does not become an incident. A loop breaker that detects repeated actions and either injects a system-level prompt asking the agent to re-plan, or halts the run. A human-in-the-loop escape hatch that routes execution to a reviewer when any of several signals cross a threshold, such as low retrieval score, failed eval, missing verification step, or unusual tool use.
Observability signals should feed the control plane too. A visible loop that ran to completion still cost tokens and time, regardless of who eventually noticed.
A first observability plan
If a team wanted somewhere to start this week, a reasonable order:
- Turn on OpenTelemetry tracing in your runtime and send it to one backend. Several of the open runtimes can do this through configuration or environment variables, so check what yours supports.
- Confirm you can see a span tree for one real run, with model and tool calls nested and token counts on each.
- Add tool arguments, results, and errors to the tool spans if they are not there. Where MCP is involved, propagate trace context through its metadata using the fixed key names once your SDKs support them.
- Add a per-run view of tokens and cost, and a per-run context receipt.
- Write three to five evals against known-good tasks and run them before your next change, so you have a before and after.
- Read five real runs by hand, top down, and write down the failures you see. Those become your next evals and tell you what is worth charting.
That takes a team from "the agent ran" to a record of what it did, what it cost, and whether it was any good.
Where Agent Voyager and Port of Context fit
Port of Context, who anchor several of the examples here, are also working on what they describe as an open agent-observability spec, the Agent Voyager project. It frames a run as a structured trajectory of events built on existing standards, using CloudEvents for the event shape and OpenTelemetry conventions for model and cost data, so the same task setup can run across different agent SDKs and have its behavior compared. It is one open effort among several in this space, included here for visibility, and a useful reference if you want a runtime-independent way to record and compare runs.
Sources
- MCP specification, version 2026-07-28 (W3C Trace Context, Logging deprecation): https://modelcontextprotocol.io/specification/2026-07-28/changelog
- OpenTelemetry GenAI semantic conventions: https://opentelemetry.io/docs/specs/semconv/gen-ai/
- Anthropic, code execution with MCP: https://www.anthropic.com/engineering/code-execution-with-mcp
- OpenHands observability and tracing: https://docs.openhands.dev/sdk/guides/observability
- Goose tracing via OpenTelemetry and MLflow: https://mlflow.org/docs/latest/genai/tracing/integrations/listing/goose/
- OpenClaw OpenTelemetry export: https://docs.openclaw.ai/gateway/opentelemetry
- Hermes structured session tracing feature request (issue #6741): https://github.com/NousResearch/hermes-agent/issues/6741
- AgentLens, the lucky-pass problem in SWE-agent evaluation: https://arxiv.org/abs/2605.12925
- Taxonomy of runtime faults in MCP servers: https://arxiv.org/abs/2606.05339
- Agent Voyager Project: https://github.com/portofcontext/agent-voyager-project
Share
Author