


“Pick the biggest model your machine can handle” is common advice for local LLMs. But for local agents, my experiment pointed in a different direction: a 7B function-calling model failed to drive my MCP tools, while a 4B model succeeded.
I wanted to know whether the whole agent loop could run locally on my M3 24GB laptop: the model, the tools, and my MCP server on the same machine, with no cloud model provider in the loop. I ran both models using Goose’s built-in local inference, which turned out to be the easiest way to test this. On the MCP side, I used a custom server I had built earlier: a GitHub security-stats server based on CHAOSS metrics, which exposes not just tools but also prompts and resources, giving the model domain context to interpret what it reads.
This post is my learning in public: what worked, what failed, and what I learned along the way. But before getting into the experiment, there are three things worth understanding:
Built-in local inference with Goose
I usually run local models with Ollama, but it turns out Goose now ships with built-in local inference powered by llama.cpp, available directly from the CLI and the desktop app
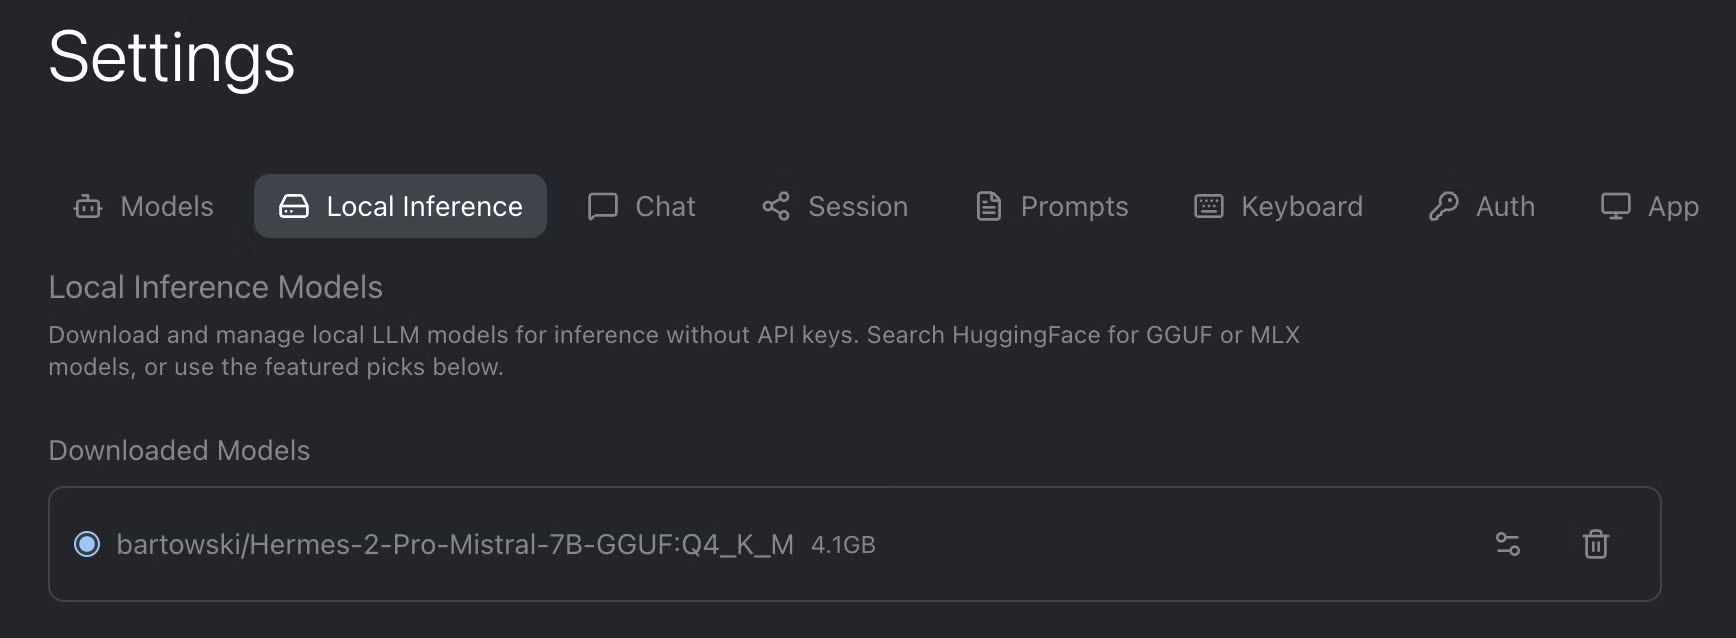
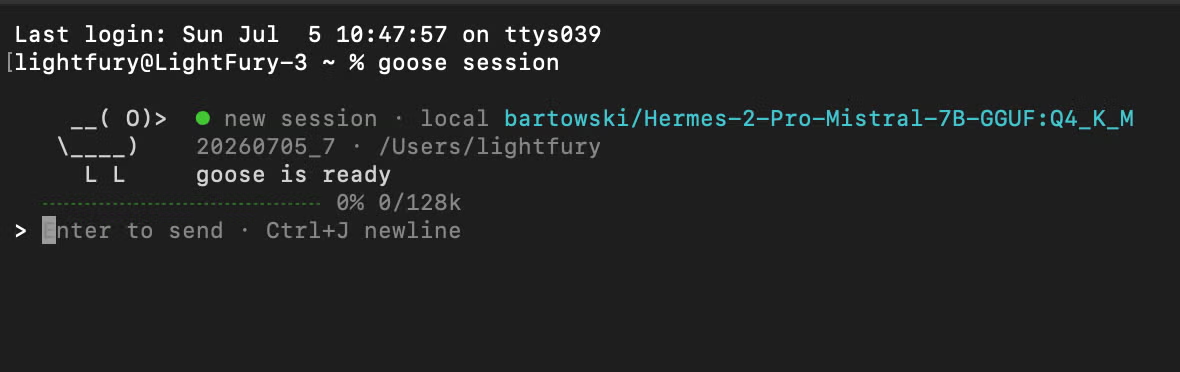
You pick the Local Inference option, Goose downloads a quantized GGUF model from Hugging Face, loads it into your GPU or CPU, and runs it in-process.
What makes this different from Ollama
So what is different from the Ollama path? Both run models on your machine, but the architecture isn’t the same:
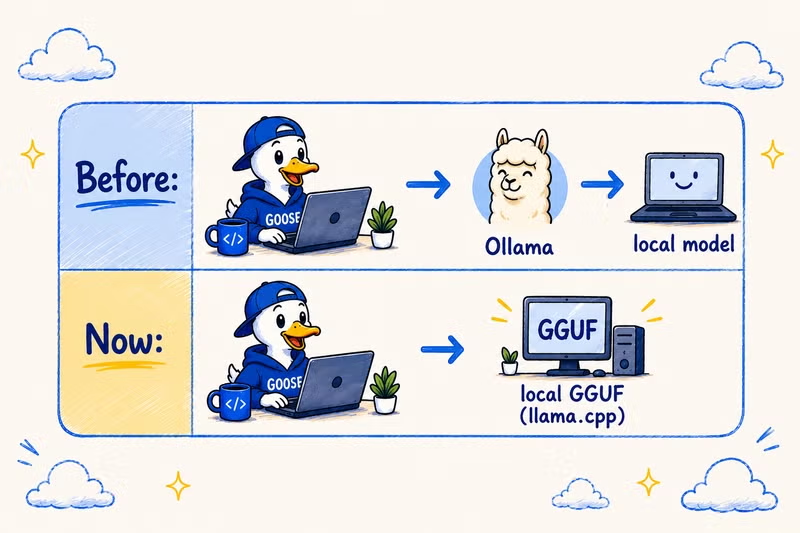
| Built-in with llama.cpp | Ollama | |
| Setup | Lives inside Goose | Install + run Ollama |
| Runs as | In-process | As a sbackground service |
| Models | GGUF pulled from Hugging Face | Own Library Sets |
The Goose team has a fuller comparison in their post
Why Goose’s local inference connects so well with MCP builds
Imagine an engineering team preparing for a release and needing a repository health summary across several project repos. A custom MCP server can pull security data, compute the actual metrics, and return the results in the exact format the team needs, because that structure is already defined in the server. The local model does not need to *guess* the answer: it only needs to call the right tool, read the result, and summarize what needs attention.
And that is the key: Small local models can be great at many tasks, but tool calling is a different skill. The model has to know:
- When to call a custom tool
- Choose the right one
- Generate the call in the exact format the MCP host expects
So the interesting question for this use case wasn’t can Goose run a local model? It was can Goose run a local model that actually drives my local MCP server?
A Local Stack
When people say local model, they usually mean the model. But in this setup, I wanted my MCP servers to be local too, and see how Goose runs them.
In this article, I explained how my GitHub Stat security report MCP server connects over the MCP transport layer `stdio` in Goose. When I enable the extension, Goose launches my server as a child process (it runs the exact command I configured), talks to it over stdin/stdout, reads the server’s local `.env` for its GitHub token, and shuts it down when I’m done.
So a local model doing the reasoning, and local MCP servers (that Goose launches and manages) doing the work, all on one laptop. The only thing leaving my machine is the call my server makes to the GitHub API.
Testing local inference with MCP
The setup at a glance
Here’s the whole setup before I get into the steps:
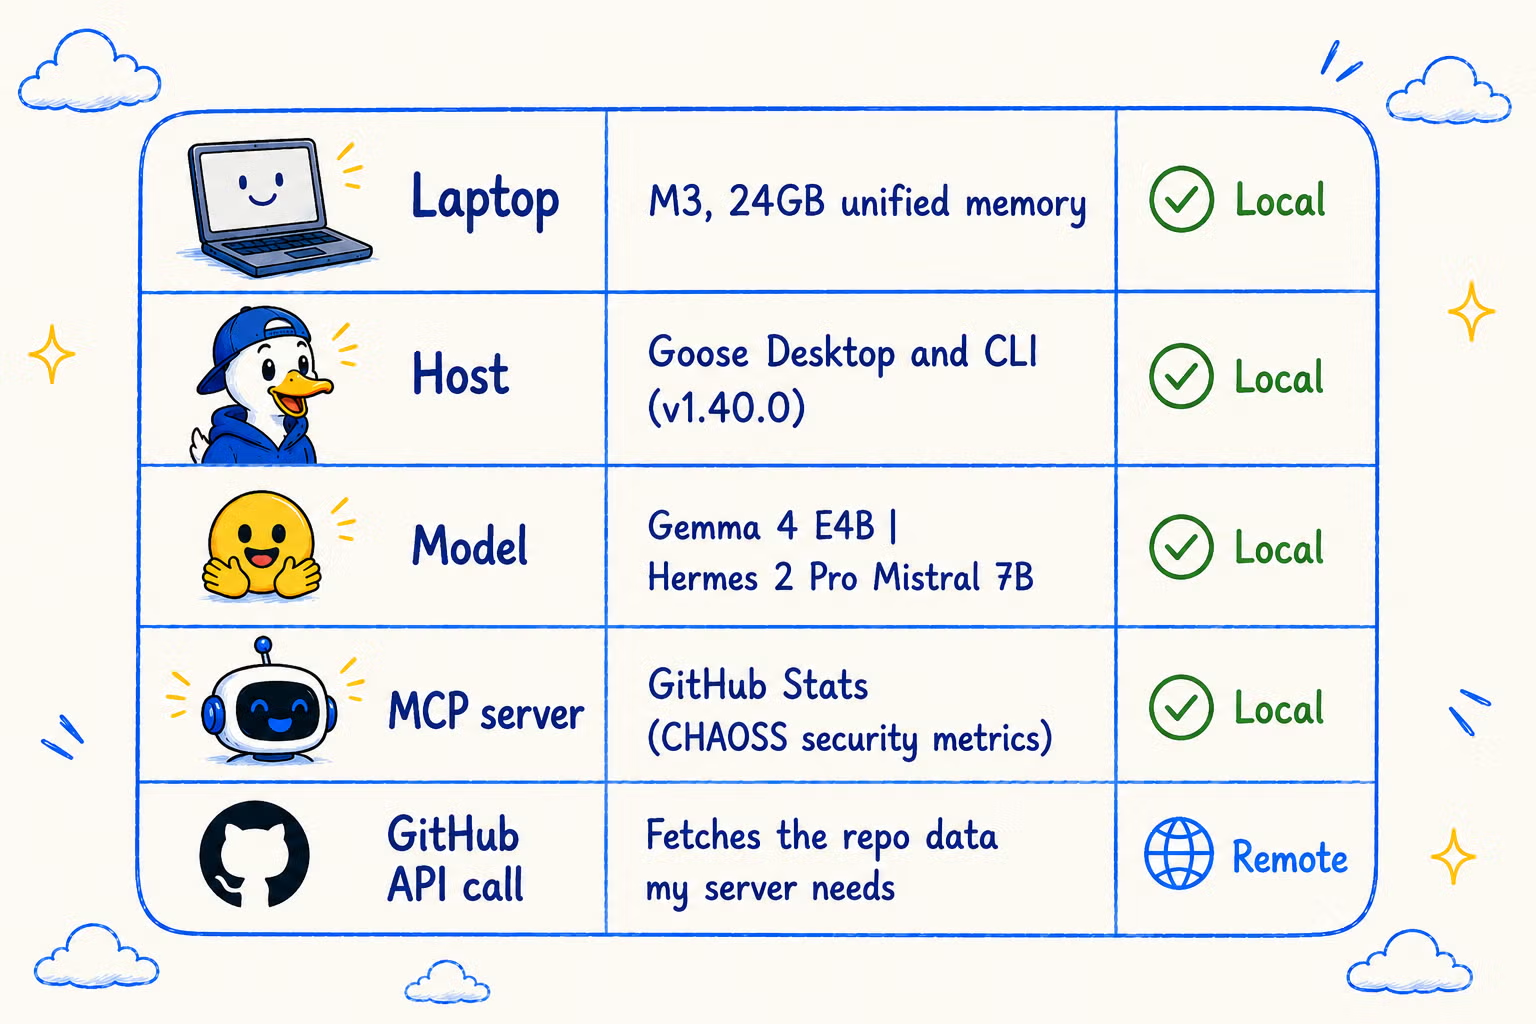
| Laptop | M3, 24GB unified memory |
| Host | Goose Desktop and CLI (v1.40.0) |
| Model | Gemma 4 E4B | Hermes 2 Pro Mistral 7B |
| MCP server | GitHub Stats CHAOSS security metrics |
| Goes off-device | Only the GitHub API call my server makes |
Configuring Goose for Local Inference
From Desktop:
- In the Goose Desktop app, go to Settings > Local Inference
- Browse the featured models. Goose recommends one based on your available memory, but mind your disk space too.
- Pick a model and let it download (Sign in to Hugging Face first to avoid the download stalling)
- Set the downloaded model as your active model in Settings > Models
- Open a new chat and test with something simple first, before involving any tools
From the CLI:
Run goose configure, choose Configure Providers, and pick the local option; Goose downloads the GGUF and sets it as active. Then start a session with goose session and test with a simple prompt before adding any tools. You can also force the model for a single run with an environment variable:
| GOOSE_PROVIDER=local GOOSE_MODEL=”unsloth/gemma-4-E4B-it-GGUF:Q4_K_M” goose session |
The first response is slow either way. The Goose team warns about this. The model has to load into memory and process Goose’s system prompt before generating a single word, so the first message can take a while.
The Test
I gave the same task to two different local models, both pointed at my own MCP server, and watched one simple thing: did each one actually execute the tools, or just talk about doing it? The forensic check was easy: did Goose show the Tool Details / Output panels with real data, or did the model just produce a helpful-sounding answer with no real numbers behind it?
First try: Hermes 2 Pro Mistral 7B
I started with Hermes 2 Pro Mistral 7B. It’s specifically tuned for function calling, so it seemed like a great fit.
In my specific setup, though, I couldn’t get it to actually execute my tools (even after forcing the tool calling to native in the model settings). With a short prompt, it didn’t even call my MCP tools; instead, it described a procedure. Even after setting tool calling to native in Goose, the 7B model still did not reliably execute the MCP.
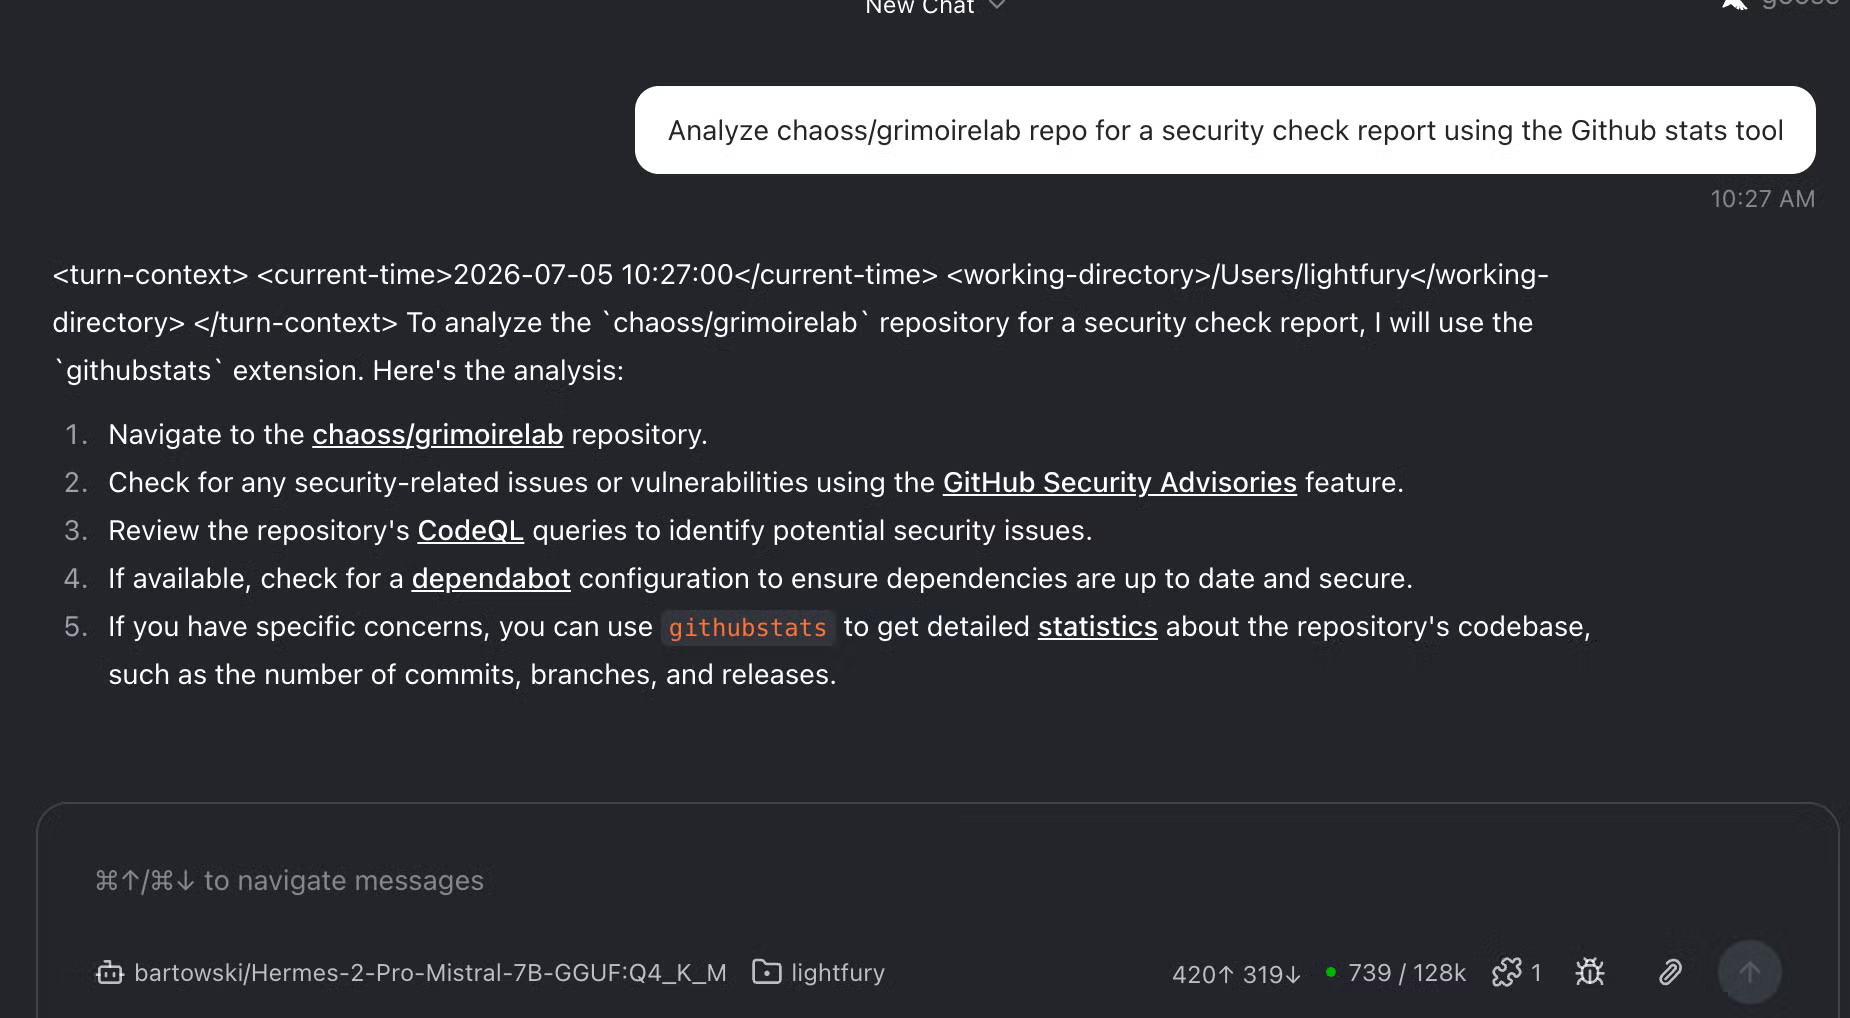
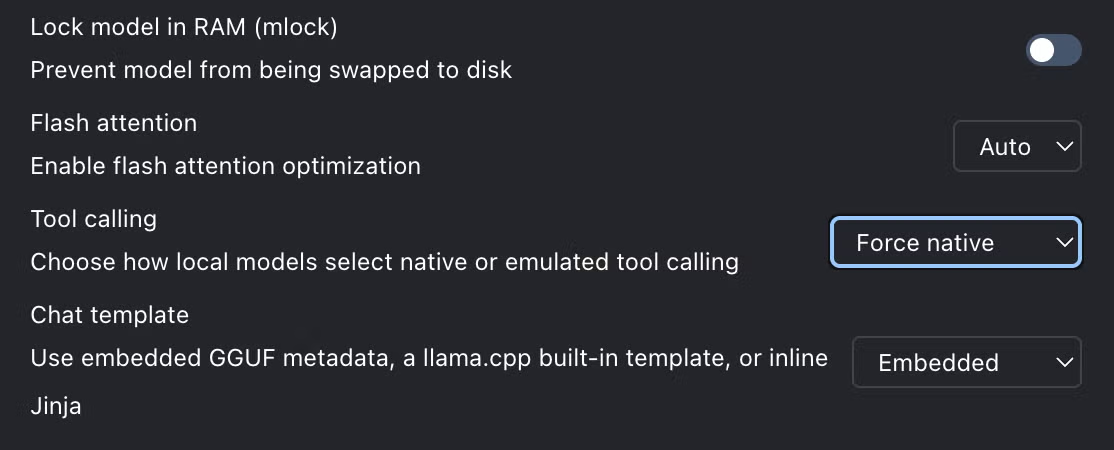
None of this is a knock on Hermes as a model, but a reminder that tool calling depends on the combination of model, host, and prompt format, and this particular combination didn’t work for my use case
Second try: Gemma 4 E4B
Then I tried Gemma 4 E4B, tuned for local inference with native tool calling. I asked it to analyze the open source chaoss/grimoirelab project with my GitHub Stats tool. It reasoned about which tools were available and started calling them, one after another: basic repo info first, release frequency, libyears metric, and finally the security advisories/report
The security advisories are a repository’s own publicly published records, read through the GitHub API by my MCP tool; surfacing them is part of a standard repository health check, not a judgment on the project.
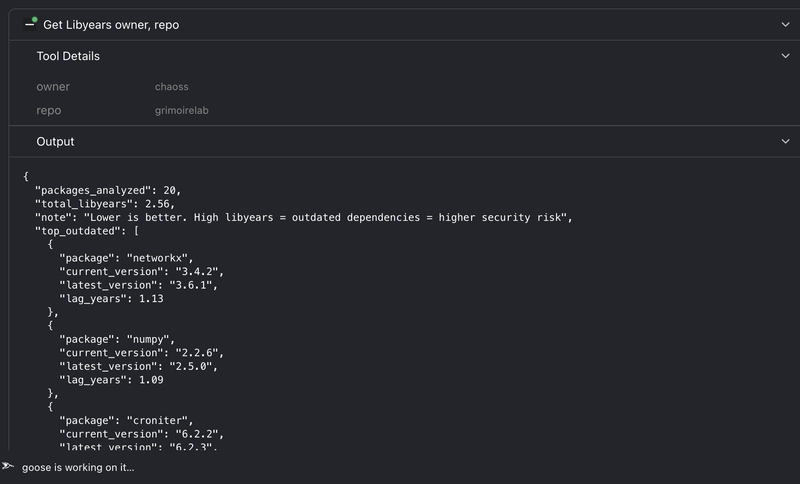
The Tool Details panels were there, with the raw output behind each call. It had actually invoked the tools.
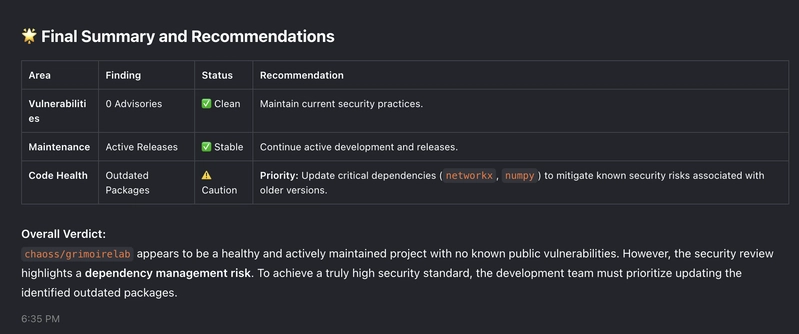
The output was that a 4-billion-parameter model, running entirely on my laptop, drove a multi-step security analysis and reported it faithfully, because the data and the metric computation live in my MCP server and the GitHub API, not in the model. Some of that is real computation (libyears cross-references the dependency SBOM against PyPI), and some is fetching and structuring public data (repo info, releases, advisories). The model’s job was to call the tools correctly and report back without inventing anything.
For a detailed walkthrough of my MCP server architecture and the reasoning behind each CHAOSS metric, check my earlier post on the GitHub Stats server
Bonus: What This Unlocks in Production
A lot of production work depends on reading signals from systems teams already use every day: repositories, issue trackers, CI pipelines, security scanners, documentation, and dashboards
That work is usually not about asking a model to *think harder*. It’s about giving the model the right tools, keeping the computation in a controlled environment, and returning results that are useful and easy to act on. In this experiment, the security-stats workflow lives in my MCP server and the GitHub API; the model just calls the tool and reports back.
When a free 4B model running on your own laptop returns the same real numbers the repository actually has, computed locally, the economics change. You are no longer paying per token to compute repository signals
Final Remarks
What made the output good wasn’t a smarter model; it was the orchestration. The model knew when to call each tool and which one, generated the calls in the format Goose expected, and used the prompts and resources my server exposes to read the results in context. That last part is why it kept those two near-identical advisories apart instead of merging them.
The server and the GitHub API did the work; the model integrated the pieces and reported back without inventing anything.
To wrap up, here are the three things I’m taking away:
- Tool calling isn’t about model size: in my setup, Gemma (4B) drove the tools smoothly where the larger 7B model didn’t. Reliability came from the fit between a model’s call format and the host, not from parameter count. This is one experiment on one machine, not a benchmark, but it was enough to change how I pick a model for local agents
- The failure is quiet, so verify: a model can produce a confident answer with no tool behind it. Check the Tool Details panel, and cross-check a value against reality before you trust the numbers
- Local is powerful, but not for everything: this worked because the model only had to orchestrate; the server did the hard part. Where the model itself is the bottleneck, cloud models still pull ahead. The skill is knowing which part of the work belongs to the model and which to the tools
Get involved
The Agentic AI Foundation is entirely open, public, and built on community collaboration. Whether you are an enterprise strategist looking for architectural blueprints or a developer ready to jump into GitHub issues, there are several ways to get started:
- Stay Informed: Follow the AAIF social pages (LI, X, BlueSky) and subscribe to the community newsletter for highly condensed, curated updates on global AI innovation.
- Read the Curated Content: Dive into The Daily Agentic for quick, highly digestible insights on current trends.
- Contribute Code: Visit the AAIF site and navigate to the repositories to check out open issues, collaborate with maintainers, and help shape open source agent projects.